Best Practices to Get Started with Data Observability + Hands-On Examples

! Get your Data Observability checklist in the end !
DATA DOWNTIME - words that send shivers down the spine of every Data Engineer. It’s literally like stopping blood flow in the human body or bringing a business to a halt.
Want an even better comparison of how severe Data issues can be?
Just as diseases can disrupt the human body, erroneous data can wreak havoc on a business. Let's explore some common types of erroneous data issues and how they can affect a company's processes:
⚠️ Corrupted Data
- Corrupted data is data that has been altered or damaged, making it unreliable or unusable. This can disrupt normal operations temporarily but generally resolves with correct measures. It can however cause discomfort, inefficiency while active and can take up valuable time for data teams to sort out.
⚠️ Outdated Data
- Outdated data can lead to decisions based on old information, which might no longer be relevant or accurate.
- Reliance on outdated data can blur an organization’s vision of the current landscape, leading to decisions that are not aligned with present realities. The General Data Protection Regulation or GDPR even states that companies must process only data that is up to date.
⚠️ Inconsistent Data
- Inconsistent data, where the same data point shows different values in different places, can create confusion and lead to conflicting conclusions. For example differences in inventory levels can lead to overstocking or stockouts, which in turn increase costs or create missed sales opportunities.
- This can cause internal strife within a business, undermining trust and reliability.
⚠️ Duplicated Data
- Duplicated data clutters databases, making it hard to find accurate and unique information.
- Duplicated data strains IT systems and complicates data management processes which can lead to errors in reports and decision making.
⚠️ Incomplete Data
- Incomplete data is like missing pieces of a puzzle, providing an incomplete picture and leading to misguided decisions. It can lead to even further errors and inconsistencies across systems and reports.
- Businesses need complete data to make informed decisions, operate efficiently, and improve overall performance.
⚠️ Data Silos
- Data silos occur when data is isolated in different departments, preventing a holistic view and comprehensive analysis.
- They restrict the flow of information within a business, hindering comprehensive insight and effective decision-making.
But how can we make sure our data is up and running? The answer is - Data observability practices.
Data observability refers to the ability to understand the health of data in your system through continuous monitoring, alerting, and insights. It encompasses five key pillars:
- Freshness - Monitoring the recency of data.
- Volume - Tracking the completeness of data.
- Distribution - Observing the consistency of data.
- Schema - Ensuring the structure of data remains unchanged.
- Lineage - Understanding the journey of data from source to destination.
For the best hands-on experience, let’s use LiTech Data Observability tool, as it’s a very comprehensive, friendly, and succinct platform.
There are different tools on the market, but I like LiTech as it’s an all-in-one solution, including end-to-end data observability, anomaly detection, data lineage, data profiling, and data diffs.
- Overall dashboard
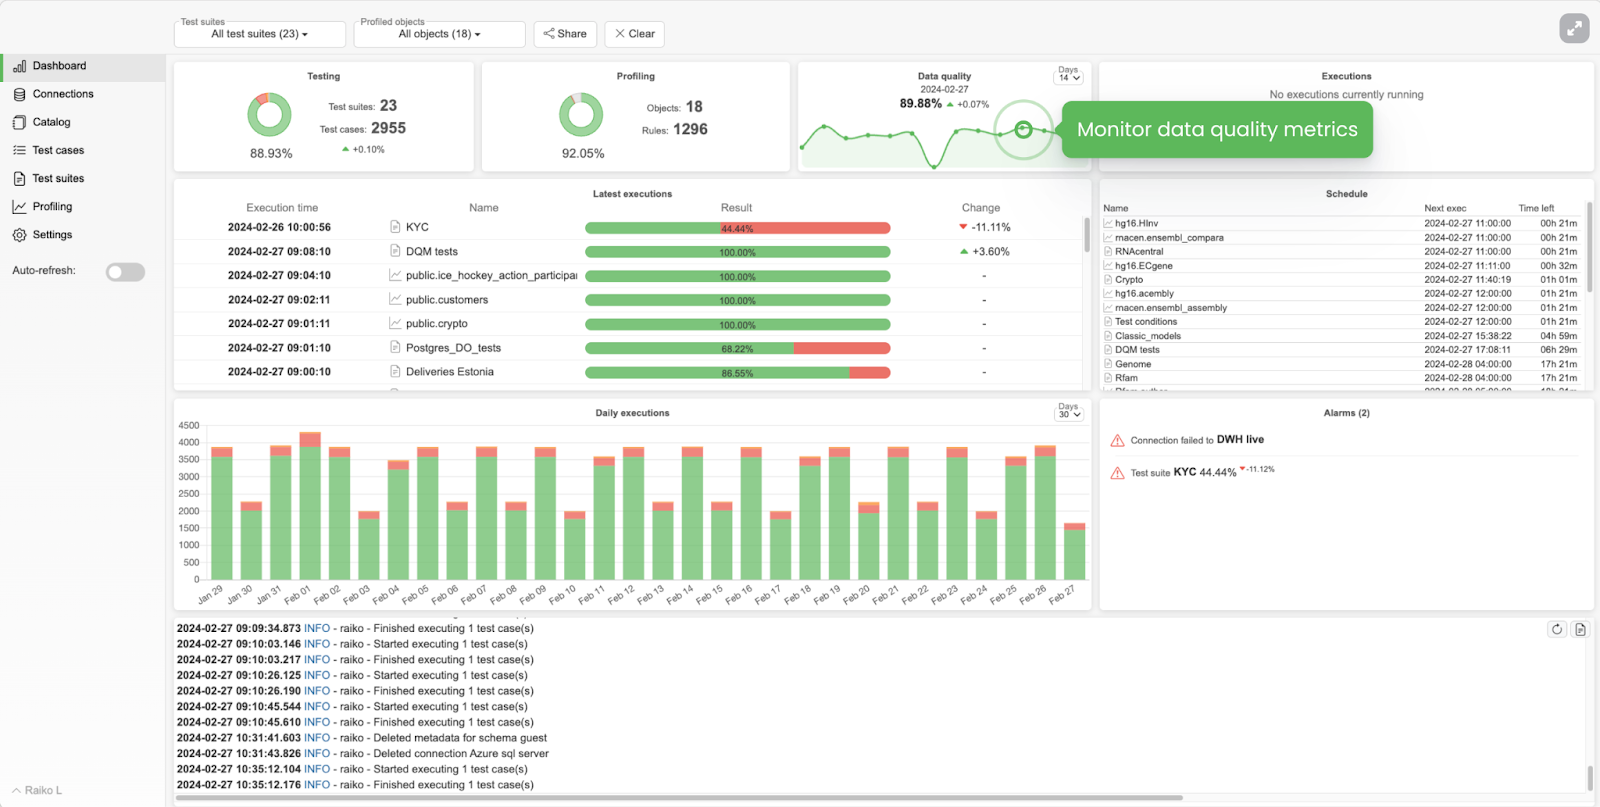
Ensure you have an overall dashboard that provides a quick overview of the system in general.
On LiTech’s platform dashboard you have a graph of overall well-being, a breakdown of indicators, and their historical tracking.
The coolest feature here is the generic Data Quality Indicator - an aggregated value of all data quality tests passed daily through ALL data sets, columns, tests, etc.
- Data catalog
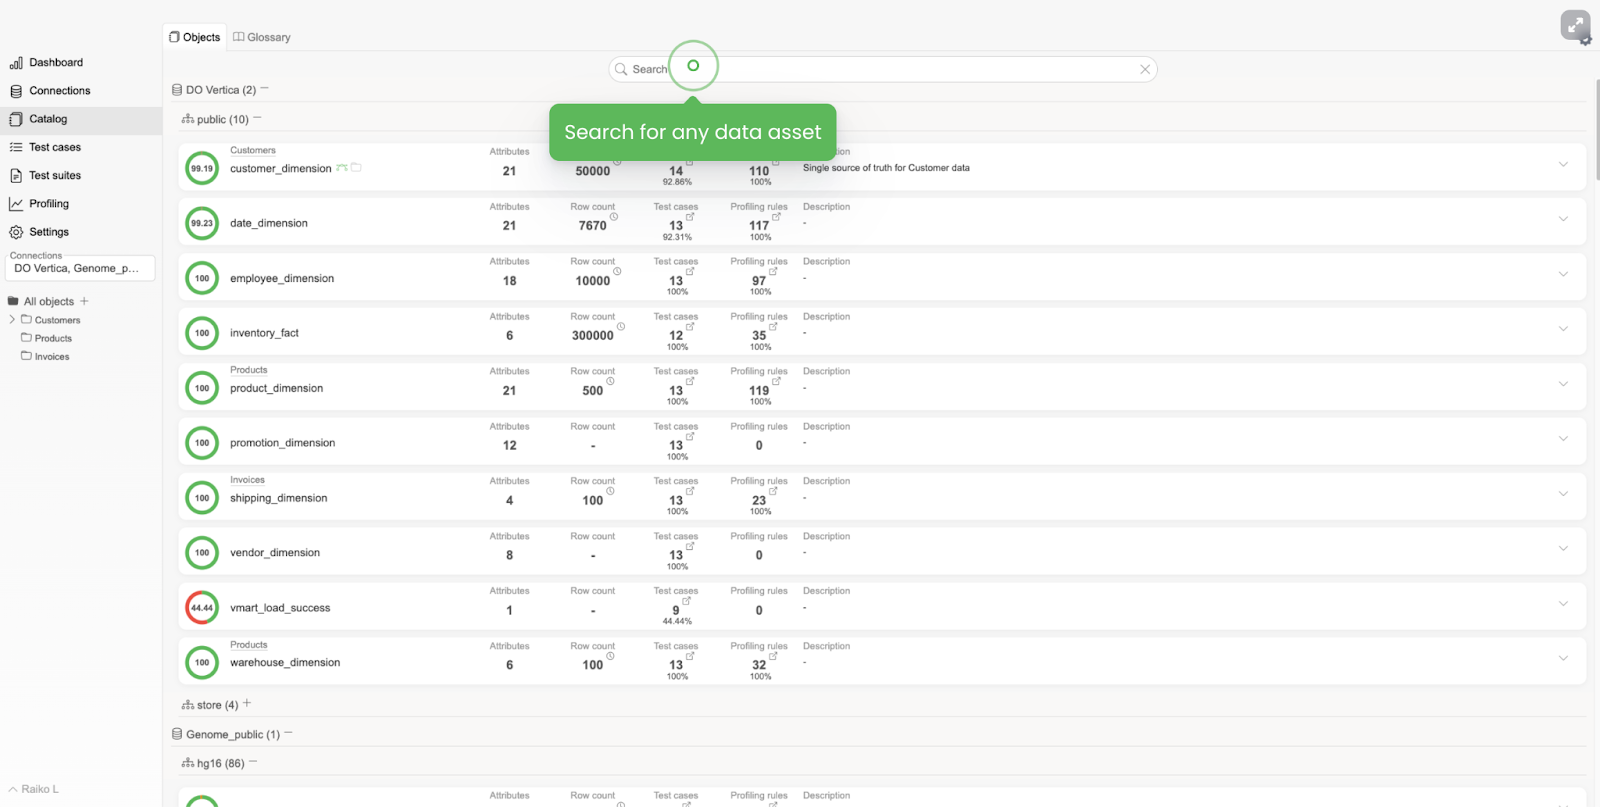
Your Data catalog should contain data about your tables, their schema, description of the nature of the data, generic stats, the quantity of data tests covered, etc.
It’s a good practice to specify owners of each particular dataset better to meet your SLA’s (Service Level Agreements). Also observe row counts, the general table’s or particular column health score, the number of test cases applied, the number of empty/unique values, etc.

- Data lineage
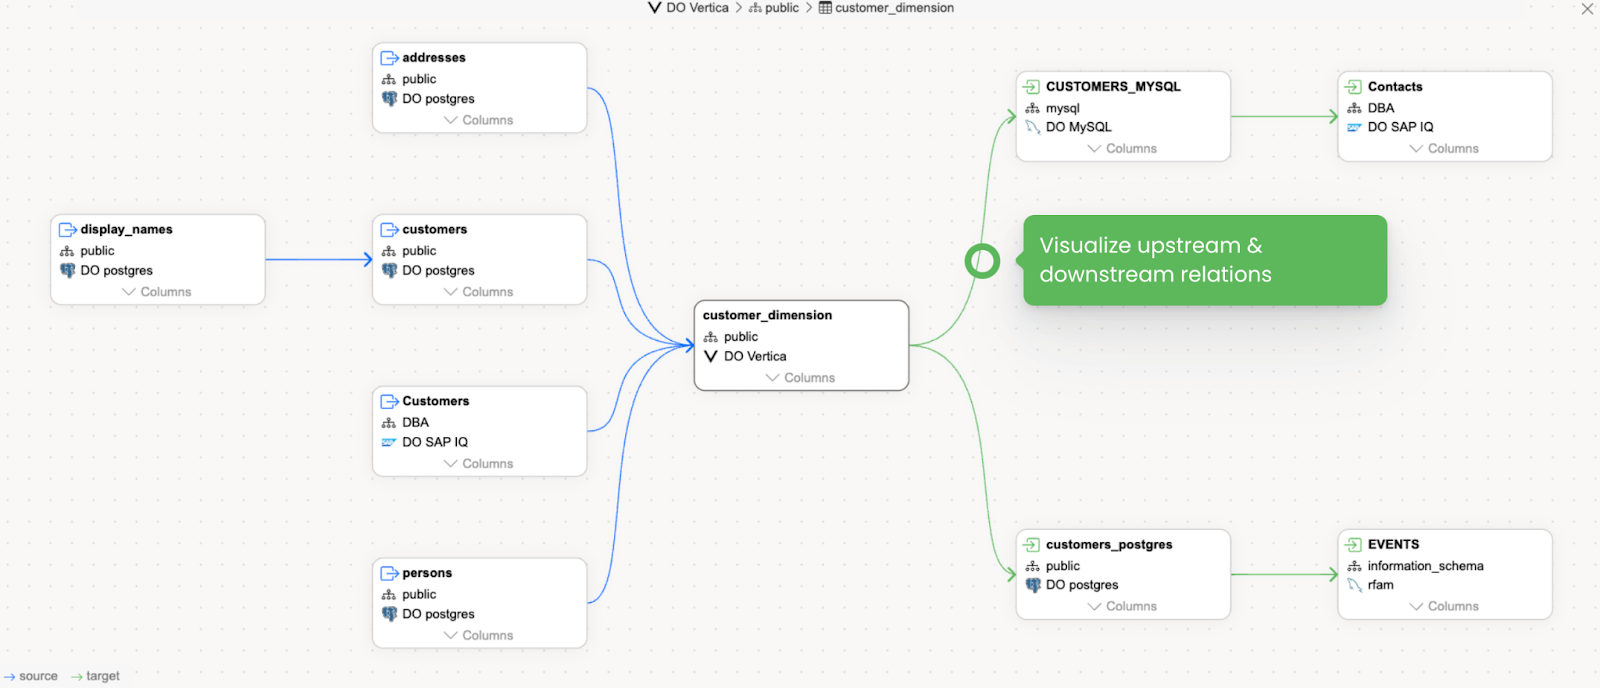
One of the best features ever: the cascade of views might be so wandering, so it takes an effort to find the origin’s column.
It’s really handy to see upstream and downstream dependencies in case you want to, let’s say, change the data type of the column or simply reuse it. Or when your source data sits in the view owned by other teams and you can always keep up-to-date with their changes.
You can even use it as a source of SQL optimization, decide if you need to pull it from that particular source and how you can make it simpler.
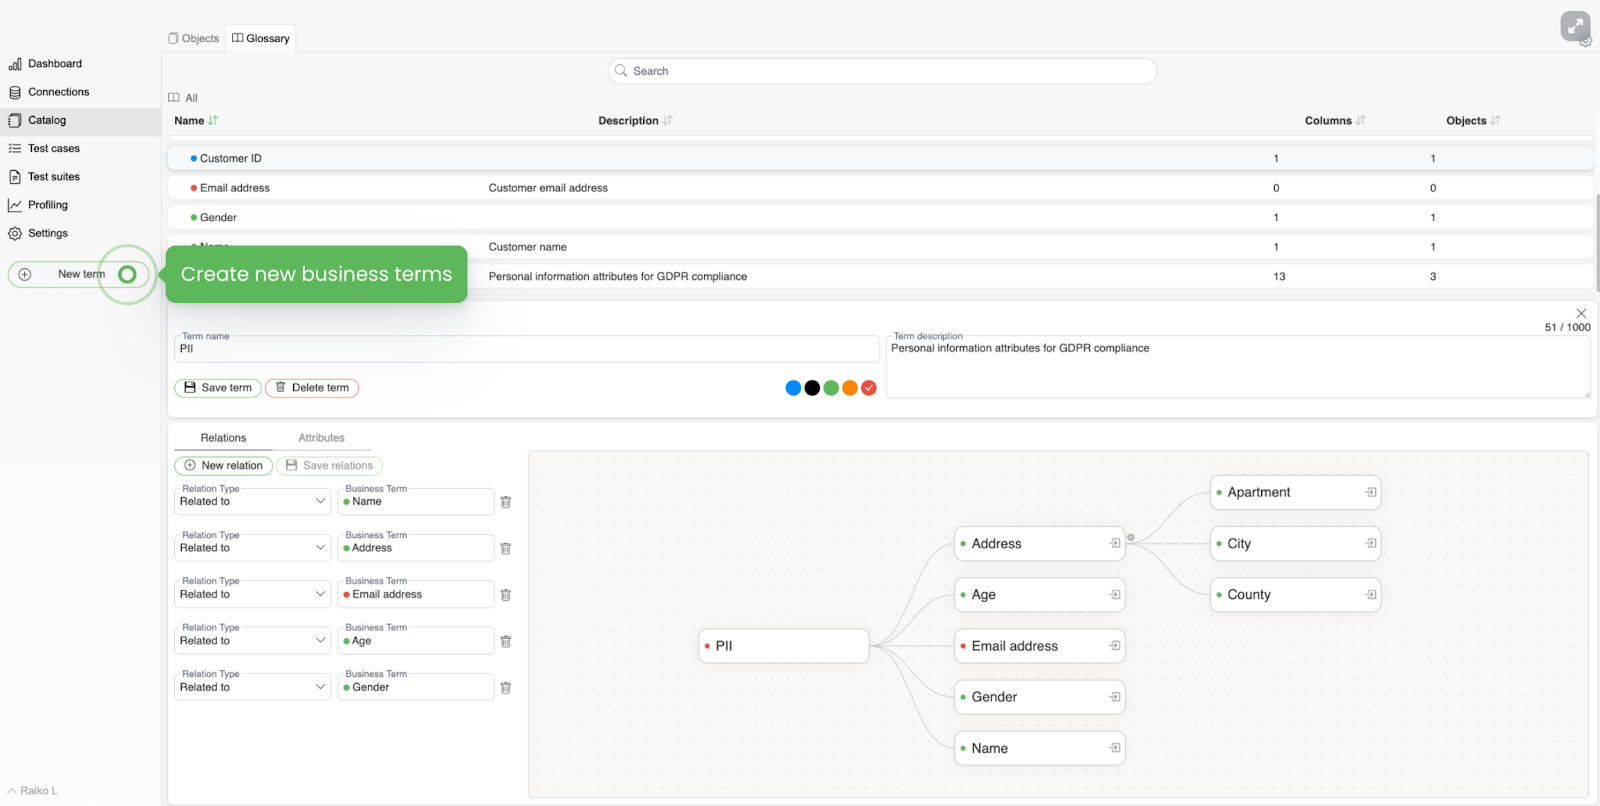
- Data glossary - the most underrated part typically.
In big companies (yeap, it did happen to me) the quantity of abbreviations and buzzwords could be overwhelming, and the biggest problem - you can’t google those! And constantly reasking your colleague what this or that means might feel awkward (please tell me I’m not the one who feels the same?).
So Data glossary might have a huge impact on your operations.
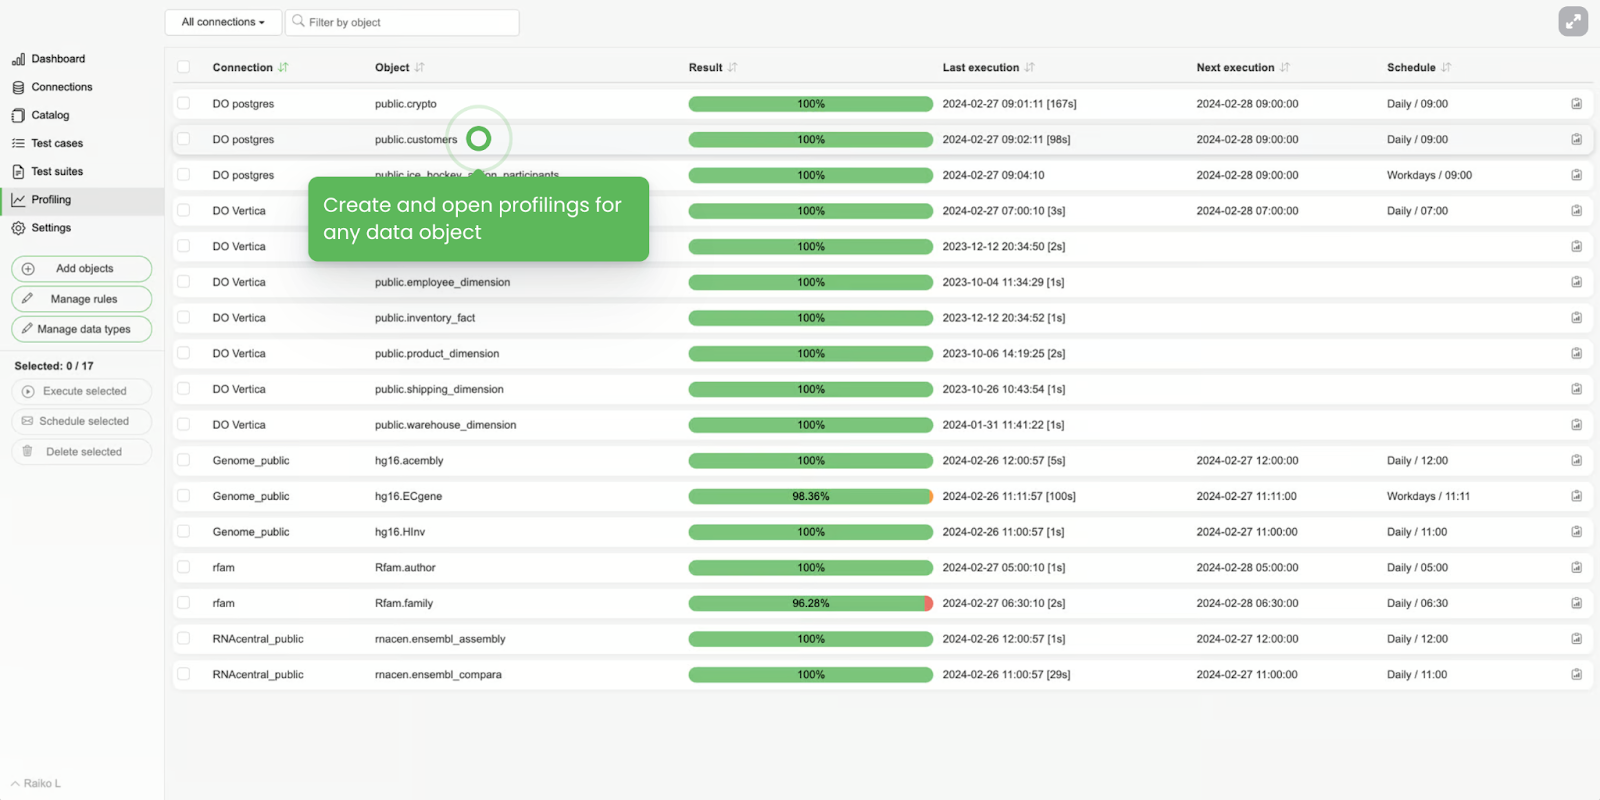
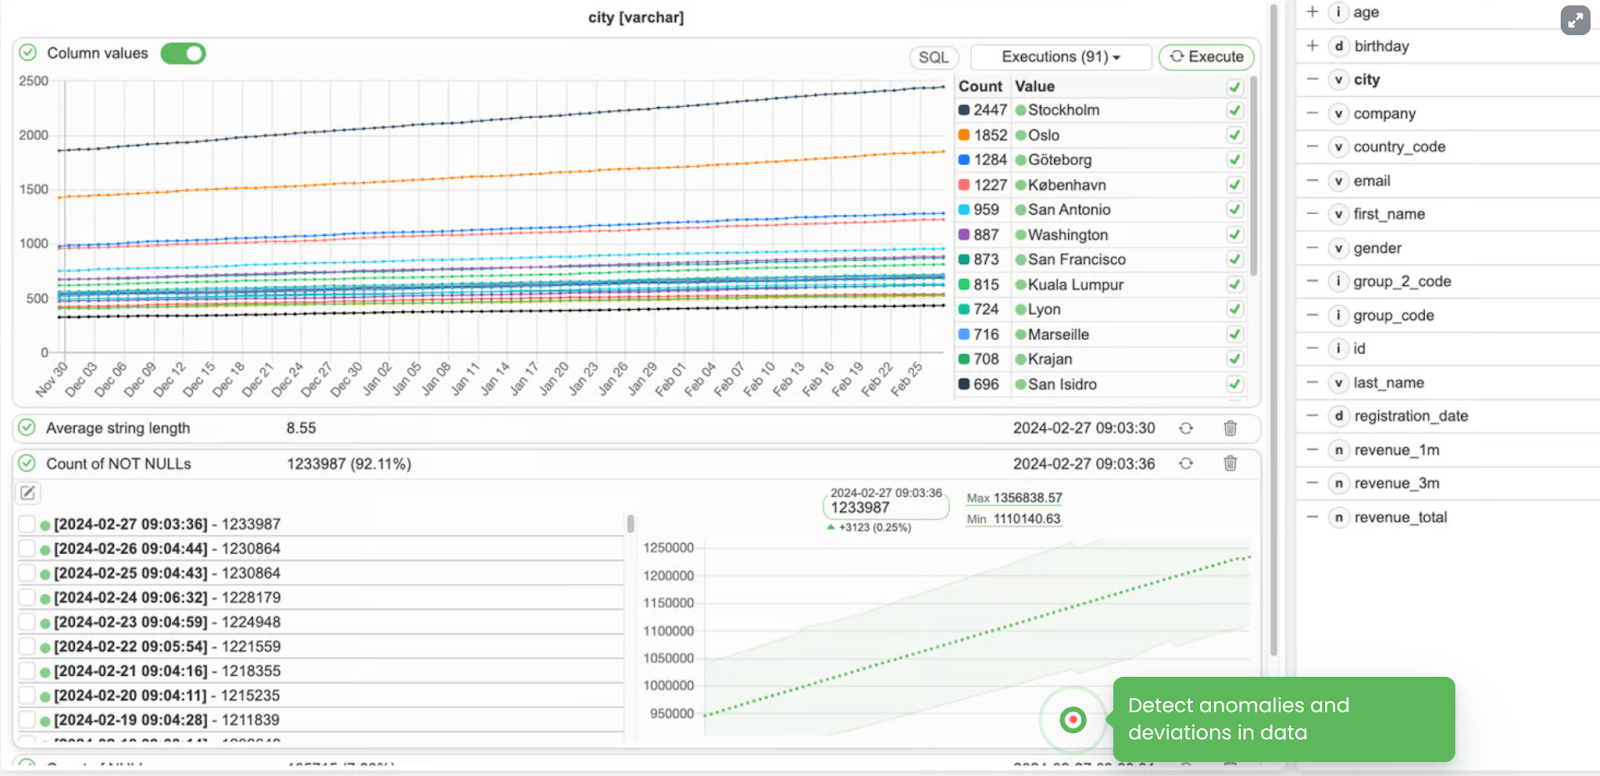
- Data profiling
The most granular level of data observability. On the columnar level, you need to detect outliers or deviations in data patterns or see averages or typical column values - that’s what it is meant to help with.
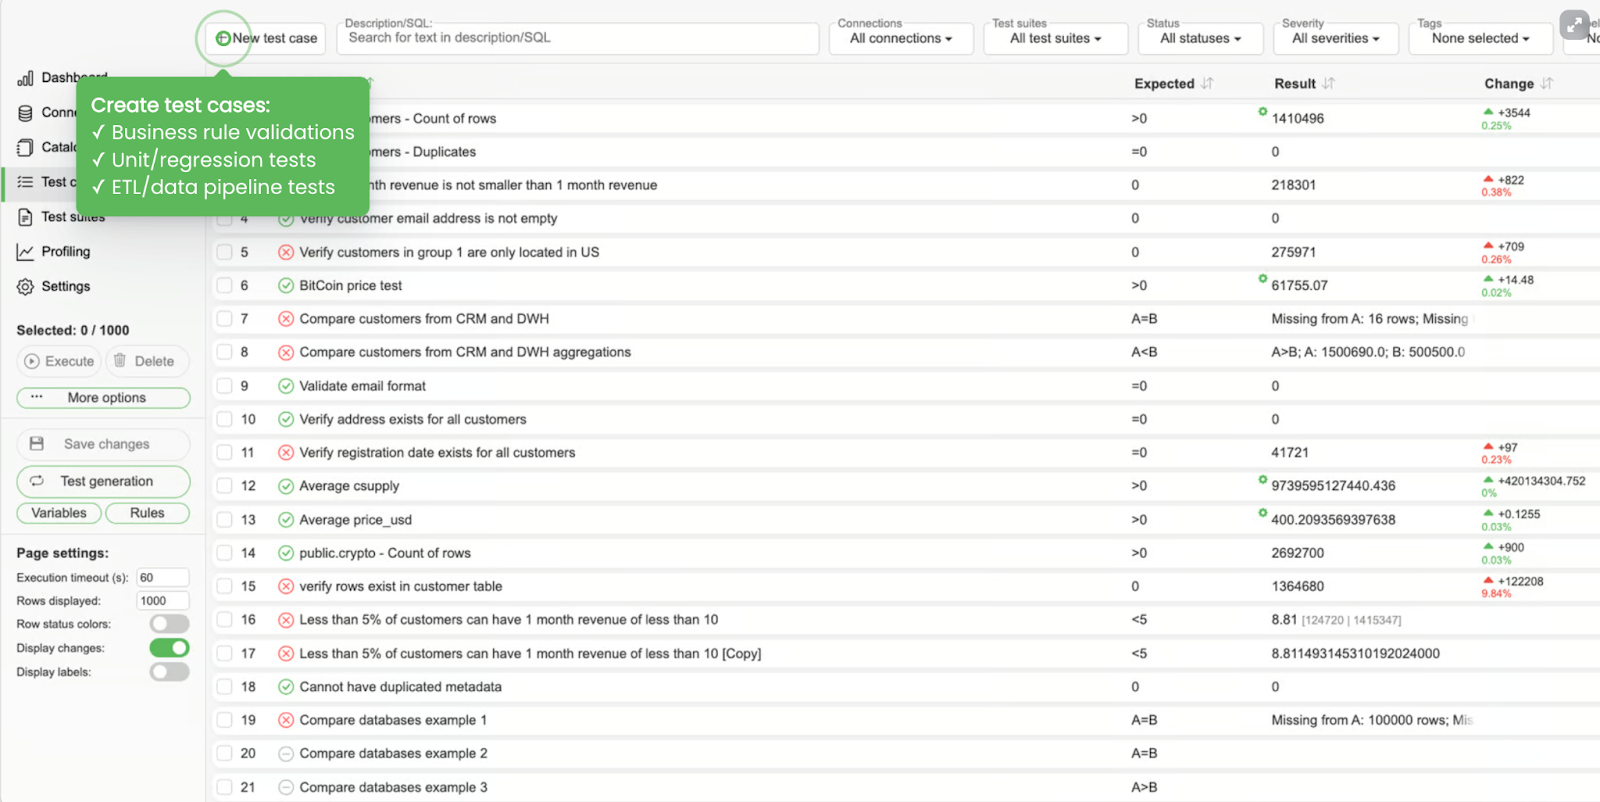
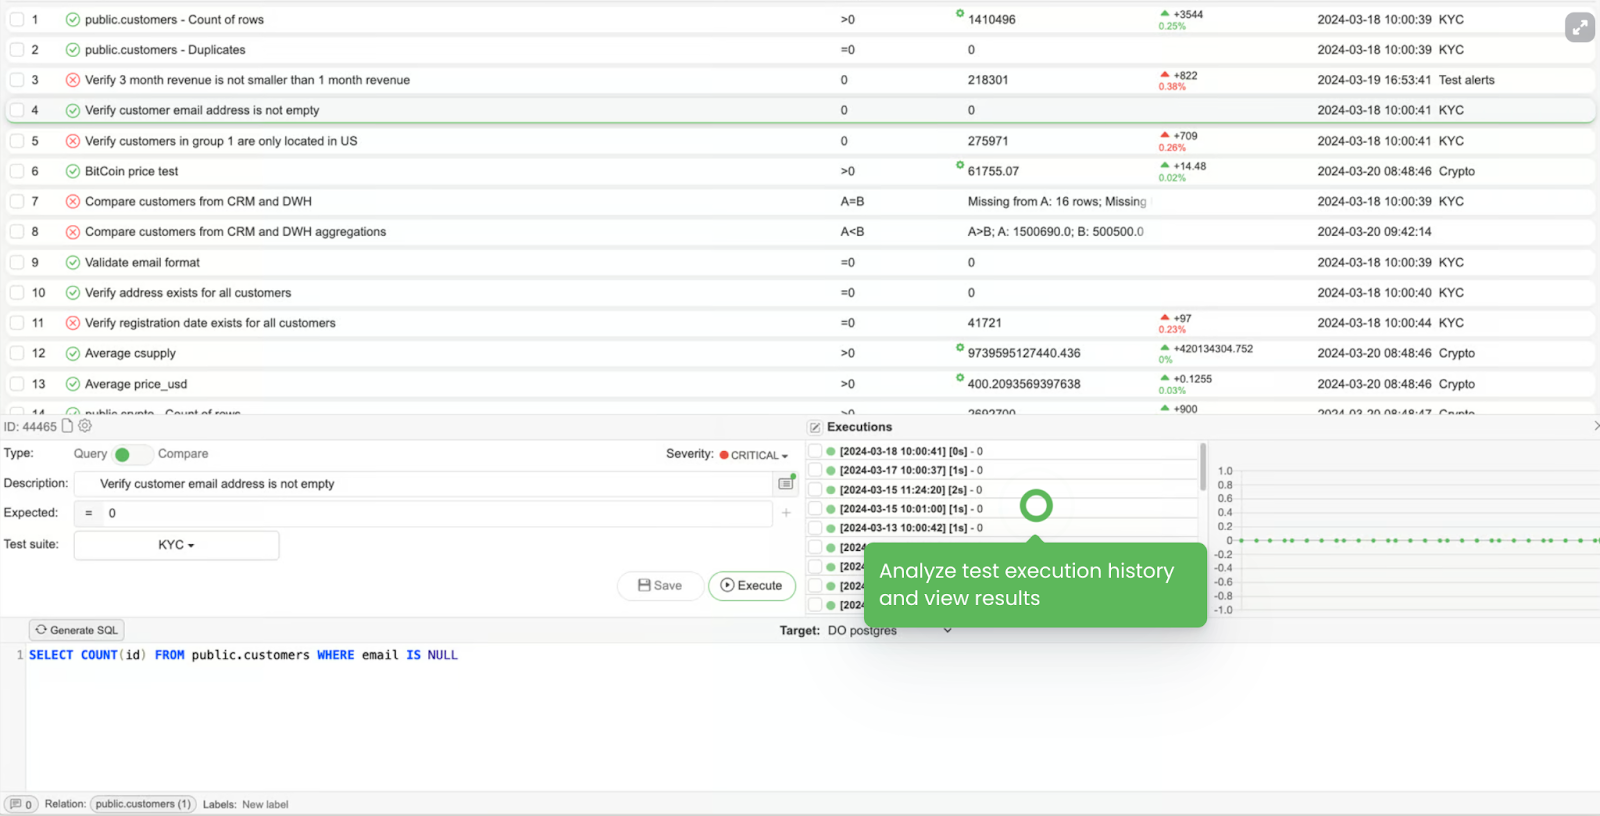
- Data quality rules
Make sure you have Data Quality Metrics. Define and implement data quality metrics that align with your business goals.
These metrics will help you quantify the health of your data and identify areas for improvement. Common data quality metrics include:
- Accuracy: Ensuring data is correct and free from errors
- Completeness: Verifying that all required data is present
- Consistency: Ensuring data is uniform across different sources
- Timeliness: Confirming that data is up-to-date and available when needed
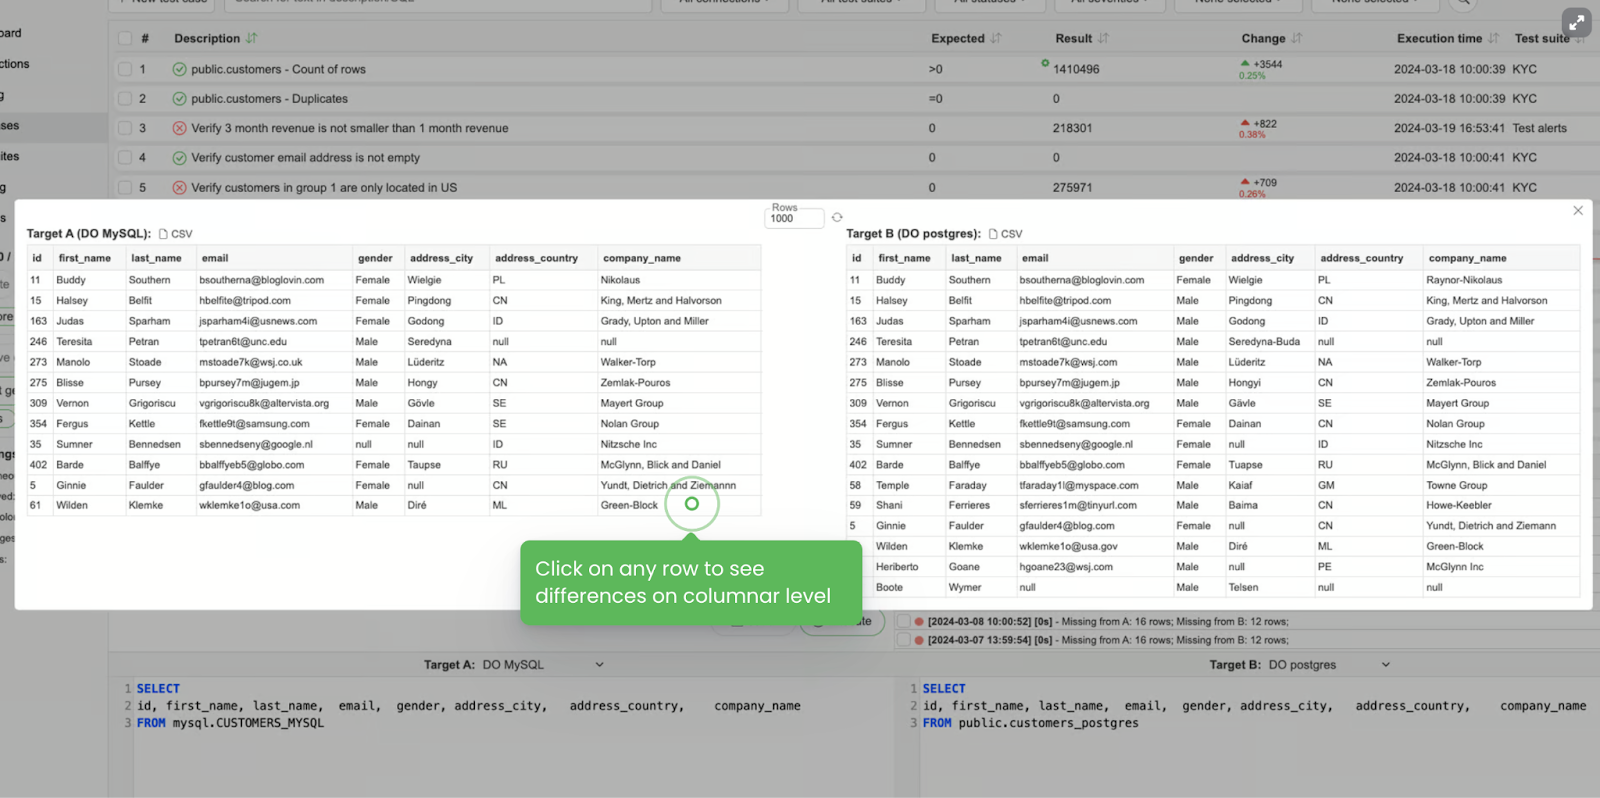
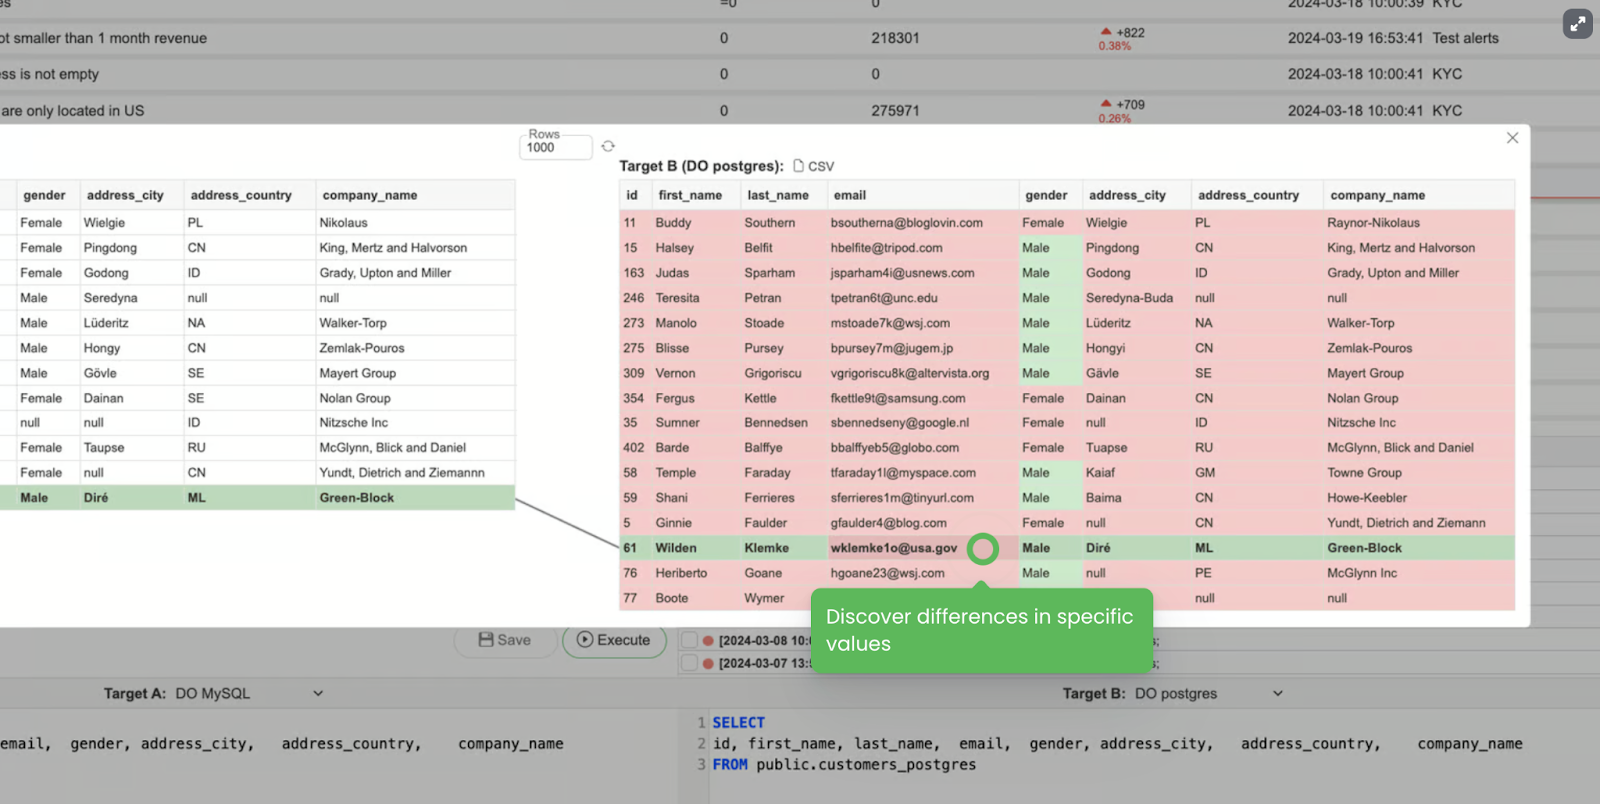
- Data diffs
My favorite one - please, COMPARE before and after. Data before in the source to the data after in the target table. Data in table BEFORE vs data in a transformed view AFTER, etc.
Some small tweaks in complex SQL queries (and I’m pretty sure your Production tables are not easy), might be hard to spot at first glance.
So visual presentation is a game changer and your go-to debugging tool.
Other non-quantitative Data Observability practices:
- Foster a Data-Driven Culture
Encourage a data-driven culture within your organization by promoting collaboration and communication between data engineers, analysts, and stakeholders. Ensure that everyone understands the importance of data observability and how it impacts decision-making.
Regularly share insights and findings from your observability efforts to highlight the value of maintaining healthy data. It also helps to explain the impact of erroneous data cause higher decision-makers don't often know it.
- Continuously Improve and Iterate
Data observability is not a one-time effort but an ongoing process. Continuously review and refine your observability practices to adapt to changing data landscapes and business needs.
Regularly update your monitoring and alerting configurations based on new insights and feedback from stakeholders.
- Automate Where Possible
Automation is key to scaling data observability efforts. Implement automated testing, validation, and monitoring to reduce manual efforts and increase the reliability of your data pipelines.
- Document and Communicate
Maintain thorough documentation of your data observability processes, metrics, and tools. Clear documentation ensures that team members can quickly understand and contribute to observability efforts. Regularly communicate updates, findings, and improvements to all relevant stakeholders.
Here you have it dears! Data observability explained in a nice view and with concrete examples.
I’ve promised you a checklist, so here it is.
DATA OBSERVABILITY CHECKLIST:
✅ Overall Data Observability dashboard is present
✅ Ensure your Data catalog contains data about ALL your tables, their schema, description, generic stats, and quantity of data tests covered
✅ Data lineage is defined
✅ Data glossary is filled in with all business metrics and it’s a go-to place for stakeholders
✅ Data profiling - ensure deviations are clearly visible and catchable
✅ Data quality - tests are set to check Accuracy, Completeness, Consistency, Timeliness
✅ Data diff monitors are properly set before and after any transformation is taking place
✅ Data-driven culture is promoted through constant insights from your observability effort
✅ You constantly iterating and reviewing your data landscape
✅ Every routine task is converted into an automation step
✅ Every important information is documented and explicit